07. 3. Zoom in/Out
DSTND Course4 Lesson1 A5 ZoomInOut
In this example below, we start with a Zoomed out version of the story.
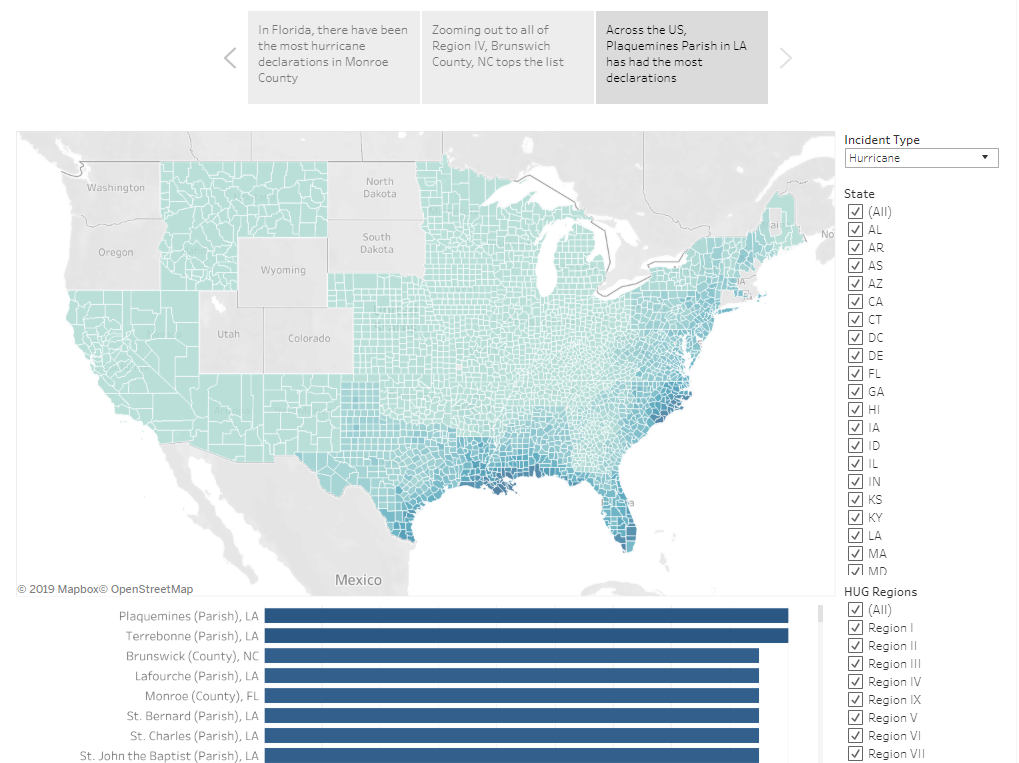
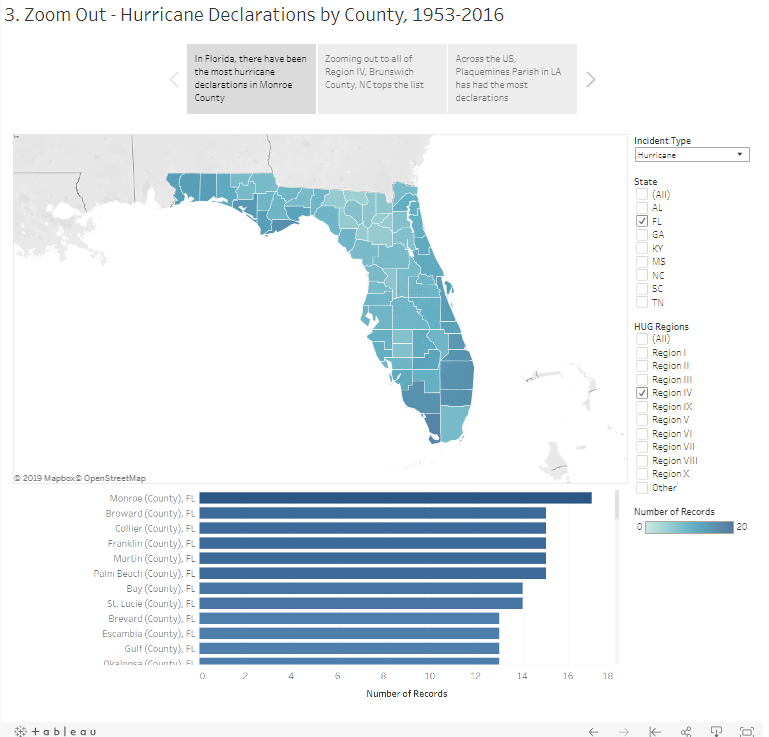
As the story advances, the story zooms in to focus on the state of Florida.
_ Tips for Finding the Third Data Story Type - Zoom In / Out:_
Does my data set contain a data story worth telling that involves zoom in or zoom out? How will I know?
Great question. Start by identifying any geographic data fields like latitude/longitude, county or zip code, and create maps that show the most critical and salient measures in your data. Consider mapping circles or shapes of records, and sizing them by the number of records, or by other important fields like the amount of sales, or crime. Then, add color to these shapes associated with your most important categorical fields to see if any patterns exist.
Next, try looking at the data at different levels of zoom. Start at the macro level and gradually zoom in to different zones or regions of interest. Do you see anything interesting or different? Go all the way down to the most granular level of zoom in your data. It could even be a single neighborhood or street corner. Does anything pop out at you?
If so, you could be well on your way to telling a great data story with zoom!